

SPRING 2018 EPDs available
NON PARENT EPD AVERAGES
|
CE |
BW |
WW |
YW |
M |
MCE |
TM |
SC |
CW |
REA |
FAT |
MARB |
TSI |
|
5.1 |
0.3 |
29 |
53 |
9 |
5.4 |
23 |
0.8 |
19 |
0.67 |
0.006 |
0.14 |
199.35 |
Using EPDs for Selection
Cattle Evaluations use the term Expected Progeny Differences (EPD) to express genetic transmitting ability of a sire for the various traits listed. An EPD is a prediction of how future progeny of a sire are expected to perform in a particular trait relative to other sires in the analysis. The key word is “difference”. The EPD itself does not imply “good” or “bad” performance. But rather, the EPD gives a prediction of the average difference to expect in the performance of a sire’s progeny relative to other sires in the same analysis.
The EPD for a given trait on each animal in the analysis is compared to every other animal in the analysis. The EPD is reported as a plus or minus value in the unit which the trait is measured.
Each EPD reported is accompanied with an Accuracy (ACC) value. ACC is a measure of reliability regarding the EPD evaluation for a performance trait. Accuracy is reported as a decimal number between zero and one: large values indicate greater accuracy and more certainty the EPD will show little change as additional progeny information is obtained.
Birth Weight EPD (BW) The expected difference in average birth weight (pounds) of progeny. Birth weight reflects prenatal growth.
Calving Ease Direct (CE) is expressed as a difference in percentage of unassisted births in first calf heifers. A higher value indicates greater calving ease. It predicts the average difference in unassisted births with which a sire’s calves will be born when bred to first-calf heifers.
Calving Ease Maternal (MCE) is expressed as a difference in percentage of unassisted births in first calf daughters. A higher value indicates greater calving ease. It predicts the average difference in unassisted births with which a sire’s daughters will calve as first-calf heifers when compared to daughters of other sires.
Weaning Weight EPD (WWT) The expected difference in average weaning weight of calves. The evaluation reflects the genetic influence on pre-weaning growth rate.

Yearling Weight EPD (YWT) The expected difference in average yearling weight of progeny. The evaluation reflects genetic influence on both pre-weaning and post-weaning growth rate.
Maternal Milk EPD (MAT) The genetic ability of a sire’s or dam’s daughters to express in pounds of weaning weight in her calves due to her maternal ability through mothering instinct and milk.
Total Maternal EPD (TOTMAT) A value to predict the weaning weight performance of calves from a animal’s daughters due to genetics for growth and maternal ability. Total Maternal is calculated by adding ½ the WWT EPD to the Maternal Milk EPD.
Scrotal Circumference EPD (SC)The expected difference in scrotal circumference (expressed in centimeters) of a bull’s or dam’s male offspring at yearling compared to progeny of all other animals evaluated. Research has also indicated a relationship between increased SC EPD and decreased age at puberty for daughters.
Carcass records are adjusted to an age constant endpoint. Therefore selection based on any or all of the carcass merit EPD are comparable among cattle at the same age endpoint. For example selection based on increased EPD for carcass weight will result in heavier carcass weights than those animals with lower EPD for carcass weights when the cattle are harvested at the same age.
Carcass Weight EPD (HCW) Expected progeny differences for Carcass Weight is a predictor of pounds of retail product at a constant age endpoint. Selection for increased values should result in heavier carcasses, while selection for decreased values should result in lighter carcass weights at the same age endpoint. Carcass Weight EPD are expressed in pounds and is a predictor of the differences in hot carcass weight between parents progeny at an age constant endpoint.
Ribeye Area EPD (REA) Ribeye area is measured from a cross-sectional area of the longissimus dorsi muscle at the 12th rib. Ribeye area is a major component of the USDA yield grade equation and selection for increased ribeye area should result in larger ribeyes and lower yield grades between animals with the same carcass weight. Ribeye area has a positive relationship with weight, the larger the animal the larger the ribeye area. Ribeye Area EPD are expressed in square inches and is a predictor of differences in ribeye area between parents progeny at a constant age endpoint.
Fat Thickness EPD (FAT) Fat thickness is measured at the 12th rib and is the primary component to the USDA Yield Grade equation. Fat thickness has a negative relationship to cutability; therefore, selection base on decreased fat thickness should result in lower yield grades and leaner cattle given the same age endpoint. Fat Thickness EPD are expressed in inches and are a predictor of differences in fat thickness between parent’s progeny at an age constant endpoint.
| QUALITY GRADE | AMOUNT OF MARBLING | NUMERICAL SCORE |
| Prime + | Abundant | 10.0 – 10.9 |
| Prime | Moderately Abundant | 9.0 – 9.9 |
| Prime – | Slightly Abundant | 8.0 – 8.9 |
| Choice + | Moderate | 7.0 – 7.9 |
| Choice | Modest | 6.0 – 6.9 |
| Choice – | Small | 5.0 – 5.9 |
| Select | Slight | 4.0 – 4.9 |
| Standard | Traces | 3.0 – 3.9 |
| Standard | Practically Devoid | 2.0 – 2.9 |
| Utility | Devoid | 1.0 – 1.9 |
Marbling Score (MARB) Marbling is a subjective measure of the amount of intramuscular fat in the ribeye muscle. Marbling score is the primary component of USDA Quality grade and selection for increased Marbling Score EPD should result in cattle with higher quality grades at the same age endpoints. Marbling score has a small genetic correlation with fat, therefore producers may select for increased marbling score EPD while not changing external fat thickness when cattle are harvested at the same age-constant endpoint. Marbling EPD is a prediction of the differences in the USDA subjective marbling score between parent’s progeny at an age constant endpoint. Marbling is expressed in the same units as the USDA Marbling Score (see table below), see the accompanying table for USDA Marbling Score in the Carcass Section.
Terminal Sire Index (TSI) The AICA Terminal Sire Index (TSI) is a formal method of combing Expected Progeny Differences (EPD) – BWT, WWT, YWT, REA, HCW, MARB and FAT – into one single value on which to base selection decisions. The TSI uses estimates of the genetic relationships between traits with an economic default value based on three year rolling USDA data.
The TSI represents a dollar index per terminal progeny produced for a bull in the AICA database, ranking them for profit potential. This dollar index is to be interpreted much like single trait EPD. For example, if Sire A’s index is $191.66 and Sire B’s index is $200.00, then we would expect Sire B’s offspring to average $8.34 more net return ($200.00 minus $191.66) than Sire A’s offspring.
Heritabilities and Genetic Correlations
Heritibility may be defined as the proportion of the observed phenotypic variation that is due to genetic variation. For example, when analyzing a group of Charolais calves from the same sire, one would expect some variation in the weaning weights. Since weaning weight is 25 percent heritable, 25 percent of the observed variation is attributable to genetics while the remaining 75 percent of the observed variation is due to environmental influences.
Traits with low heritability estimates are influenced more by environment than by genetics, thus genetic progress from selection may be slow. Traits with low heritability respond greater to the effects of crossbreeding. Since heritibility is already an integral part of the EPD calculation, EPD reflect actual differences and require no adjustment.
Accuracy
Accuracy values give us an indication of how close our estimates are to an animal’s true genetic value. Accuracy values are extremely useful to breeders in determining the reliability of an EPD. An accuracy value can range from 0.0 to 1.0, depending on the amount of information that is known about an animal for any one of the reported traits. As the amount of information included in the analysis of a trait for an animal increases, the accuracy value for that trait increases accordingly.Table 1 shows the standard error of prediction (possible change value for an EPD) at various levels of accuracy for the traits reported. You will notice that as accuracy level increases, the possible change value decreases. Still, an EPD can change from year to year even though it may have a high level of accuracy. The point to remember is that the expected change of an EPD with a high ACC is correspondingly less than those of an EPD with a lower ACC value.
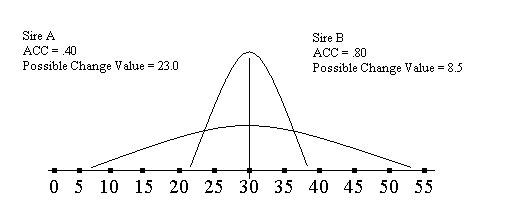
The possible change of identical EPD, given different levels of accuracy can be seen in the example. Two sires have YWT EPD of +30, but different ACC values. This figure illustrates the possible range within where the true genetic value is. Sire A has an ACC of .40 with a possible change value of 23 pounds, and Sire B has an ACC of .80 with a possible change value of 8.5 pounds.
As additional information is reported and accuracy levels increase, we would expect the EPD to stay within the range of the possible change value.
Even though both sires have an EPD of +30 pounds for yearling weight; Sire B has a higher reliability that his true genetic value is within the narrower range of 21.5 to 38.5 (30 ± 8.5).
The ACC of a given EPD can help determine the amount of risk a breeder is willing to take in his breeding decisions. Let us compare the sires in the example again. Which sire is more desirable for your breeding program? The sire with the high ACC is more predictable, but the amount of genetic change that can be made is correspondingly limited as well. Sire A has the same YWT EPD, but his true genetic value may be beyond that of Sire B. Therefore Sire A could possibly increase the amount of genetic progress made, but he is also more of a risk because his true genetic value falls within a wider range.
Possible Change Values
Accuracy values help determine the amount of risk associated with genetic repeatability, but they are not foolproof. Click on the link above to view the possible change values of an EPD with a given accuracy value (ACC). Approximately 70 percent of the time the EPD will not deviate outside of these parameters.
Genetic Trend
This chart lists the genetic trend of the North American Charolais breed for birth weight, calving ease, weaning weight, yearling weight, maternal milk, maternal calving ease and scrotal circumference. the chart also lists the genetic trend of the US Charolais breed for hot carcass weight, ribeye area, rib fat thickness and marbling for most recent years.
Source: American International Charolais Association
Leave A Comment