Welcome to the third in this series of articles on the beef price cycle driven by the beef cattle cycle. (Find Part 1 here and Part two here.) The focus of this series is to suggest how cattlemen might make the cattle cycle work for them rather than against them.
The first two articles, among other things, suggested that heifers born in the low part of the beef price cycle tend to produce calves in the higher part of the price cycle. Heifers born in the high part of the price cycle tend to produce calves in the lower part of the price cycle.
The problem is that the economic stimulus generates just the opposite reaction. High calf prices tend to stimulate producers to hold back replacement heifers nationally, and low calf prices tend to stimulate a national reduction in replacement heifers. You would be surprised at the phone calls I received in 2015 from outside investors wanting to invest in beef cow herds after the all-time-record 2014 prices.
- S. calf crop
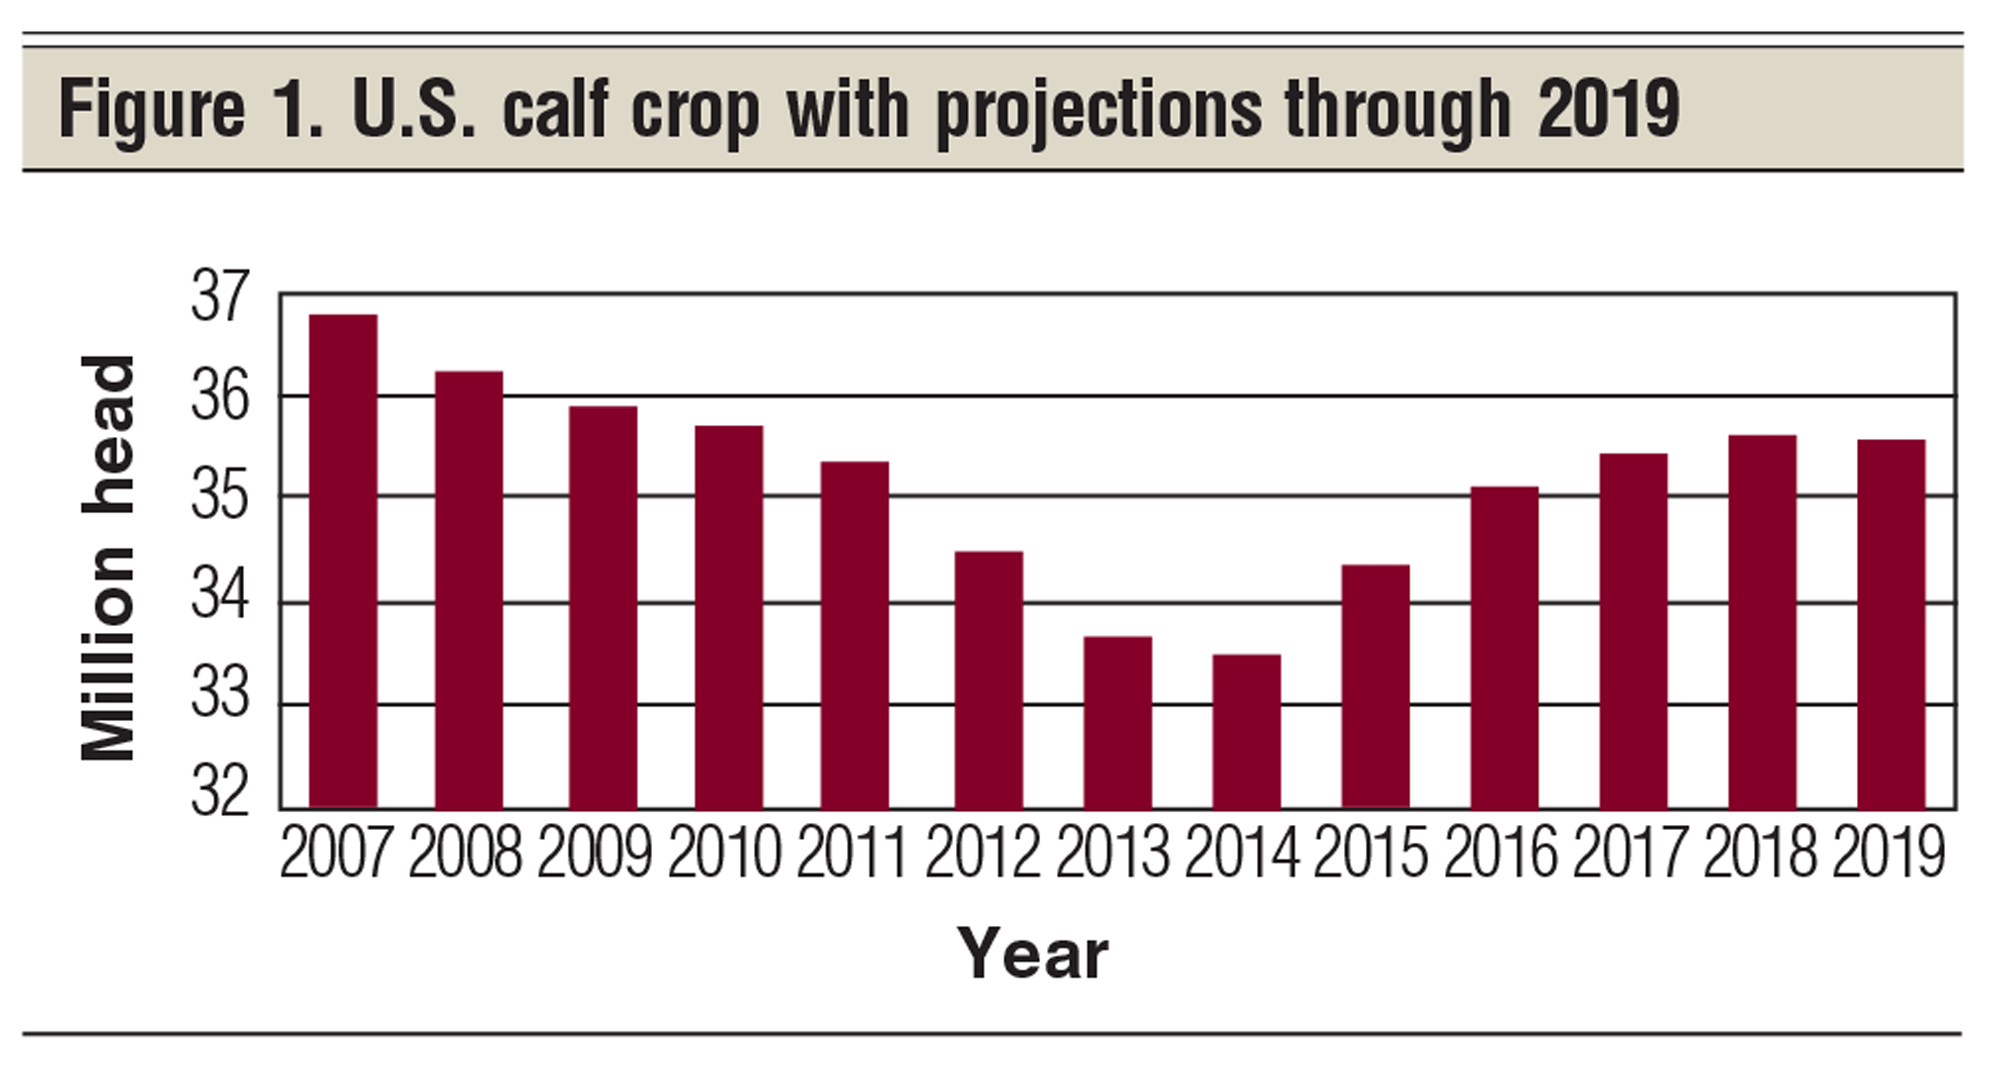
More beef cows mean a larger calf crop. Figure 1 shows the U.S. calf crop history from 2007 through the current 2017 calf crop, with projections for 2018 and 2019. This chart covers the suggested current beef price cycle of 2009-19 plus two earlier years, 2007 and 2008.
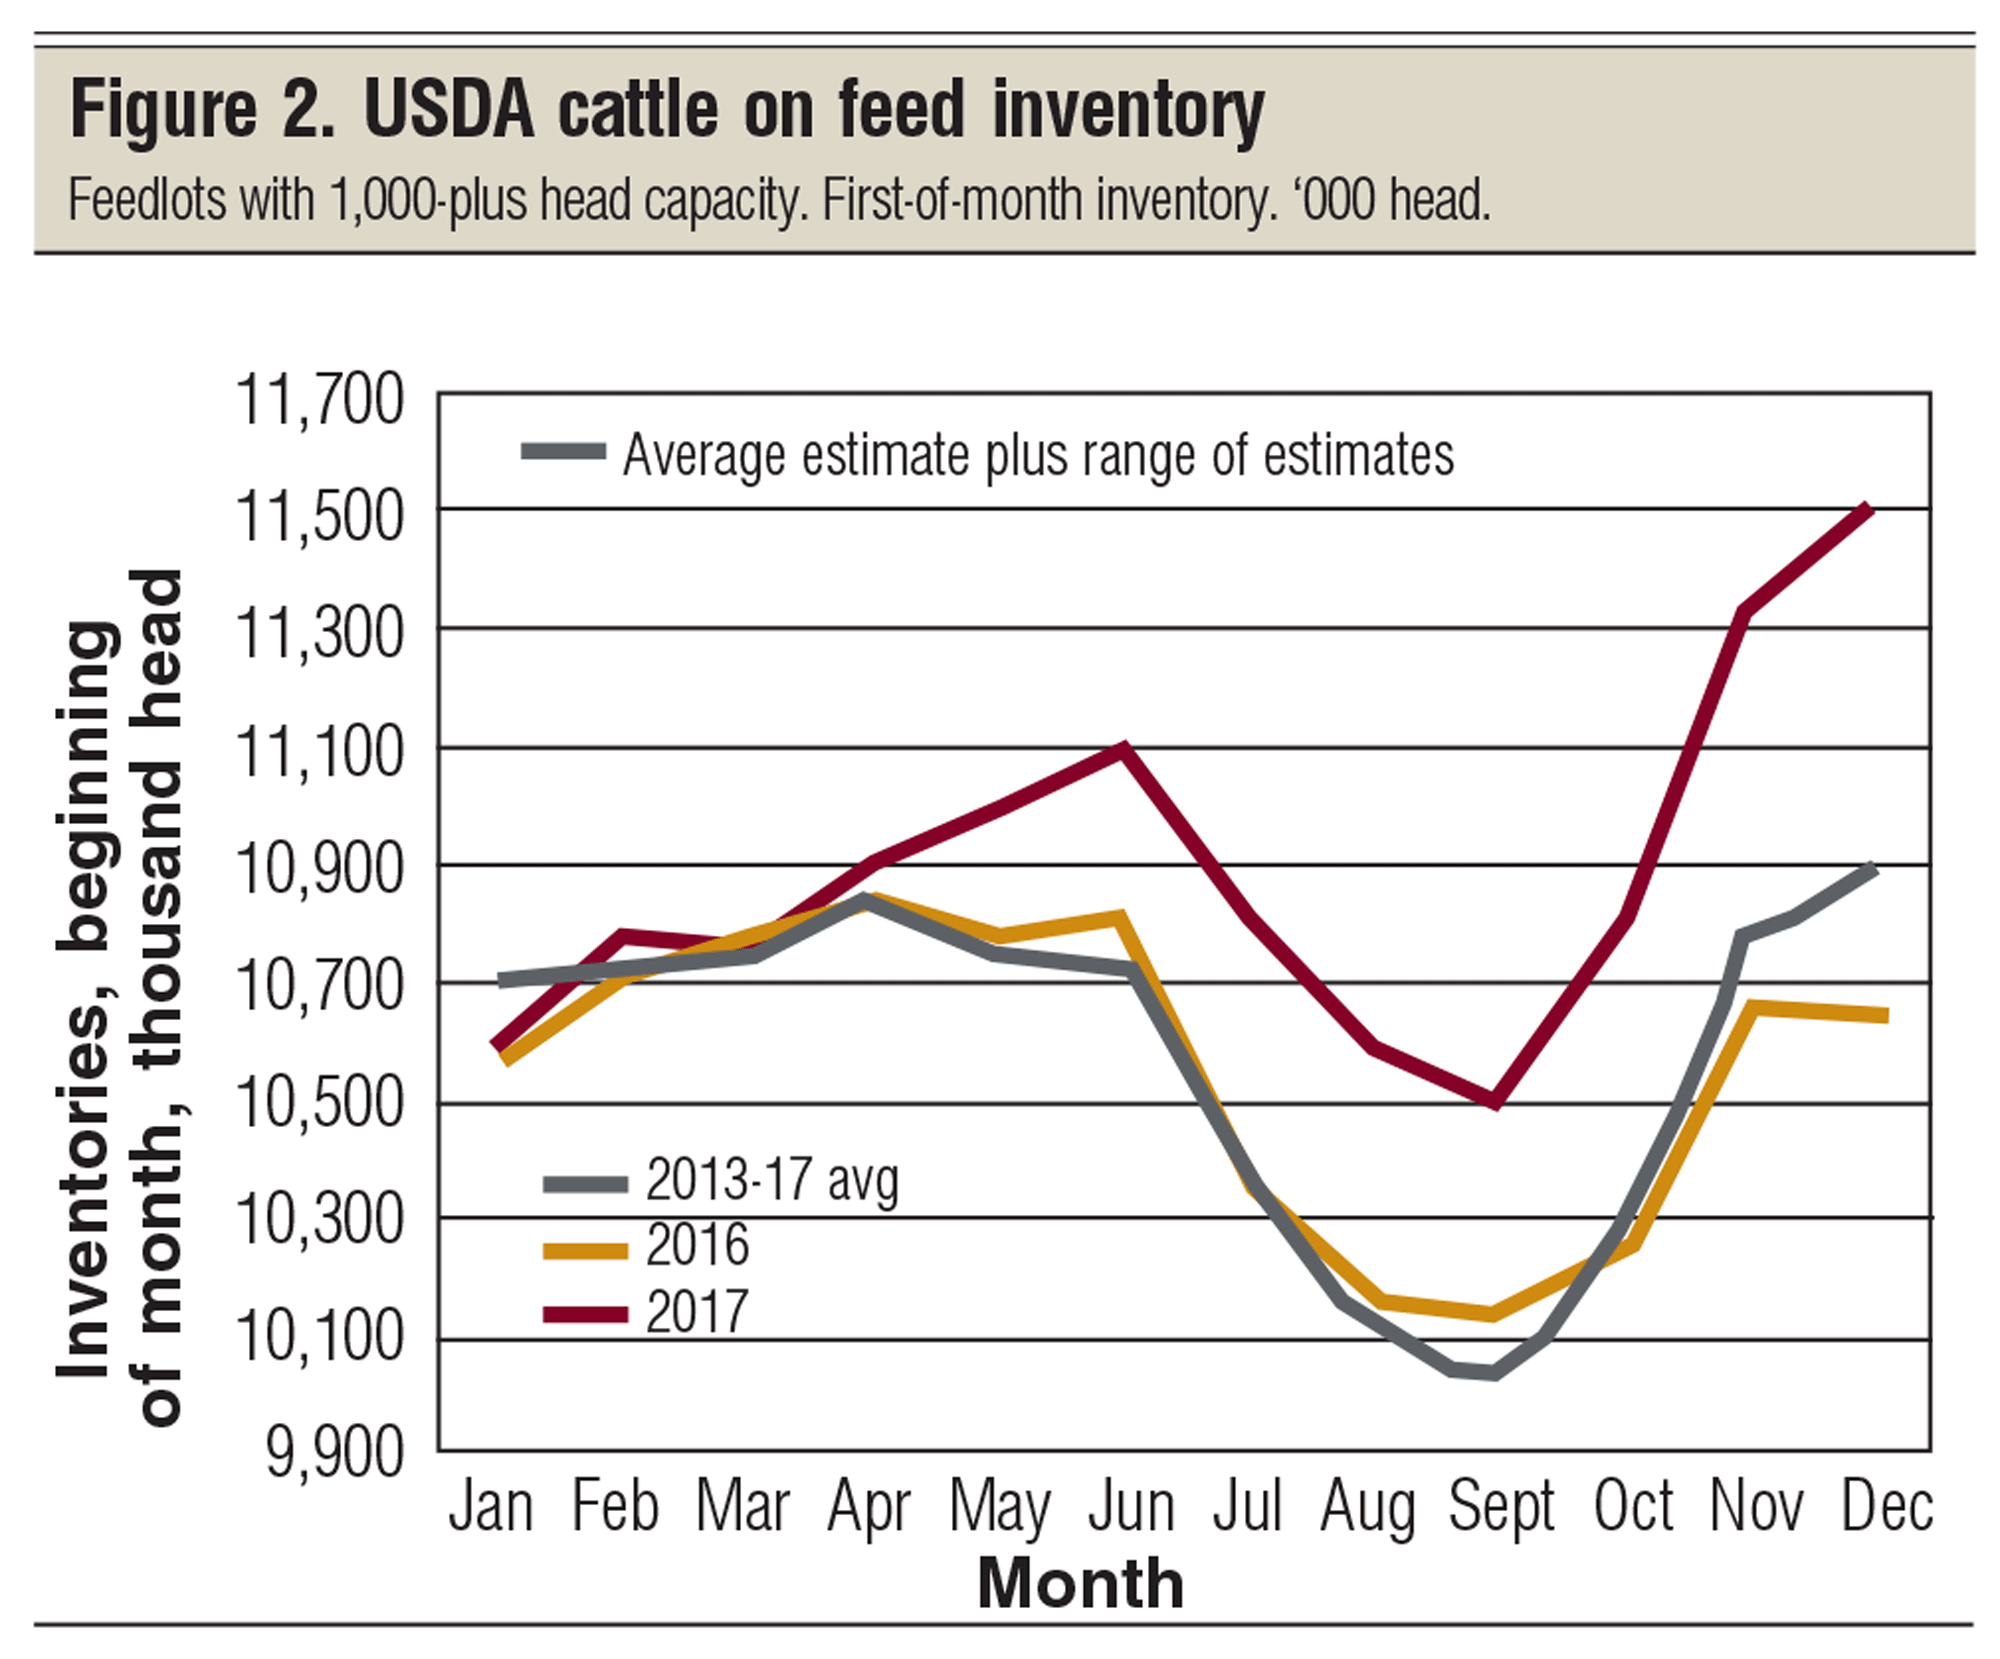
The near-term impact of calf numbers on cattle on feed is reflected in Figure 2. Note the increase in cattle on feed for 2017 over 2016, and the 2013-17 average.
Remember, increases in slaughter cattle harvest lag the increase in beef cow numbers. This, then, suggests cattle slaughter will increase into 2020 to 2021, generated by the current cattle cycle projected to run 2009 to 2019.
Before I go any further, I need to point out that carcass weights of U.S. fed steers have been on a steady increase for years. In 1992, we averaged around 760 pounds per carcass, and this weight has steadily increased to approximately 880 pounds by 2014.
One significant impact of higher dressing weights is that we do not need as many beef cows to meet beef demand. In general, the long-run trend in beef cow numbers has been downward since the high in the 1970s.
Projecting forward into next cattle cycle
Let’s now take a look at some Food and Agriculture Policy Research Institute (FAPRI) projections for the end of the current cattle cycle and the beginning of the next cattle cycle.
The red line in Figure 3 presents FAPRI’s 2017 projections for beef cow numbers through the end of the current cattle cycle and well into the next cattle cycle, vs. FAPRI’s price projections for 650-pound Oklahoma feeder steers (yellow line) over these same years. As beef cow numbers go up, feeder prices are projected to go down. Then, as beef cow numbers go down, feeder prices are projected to trend upward.
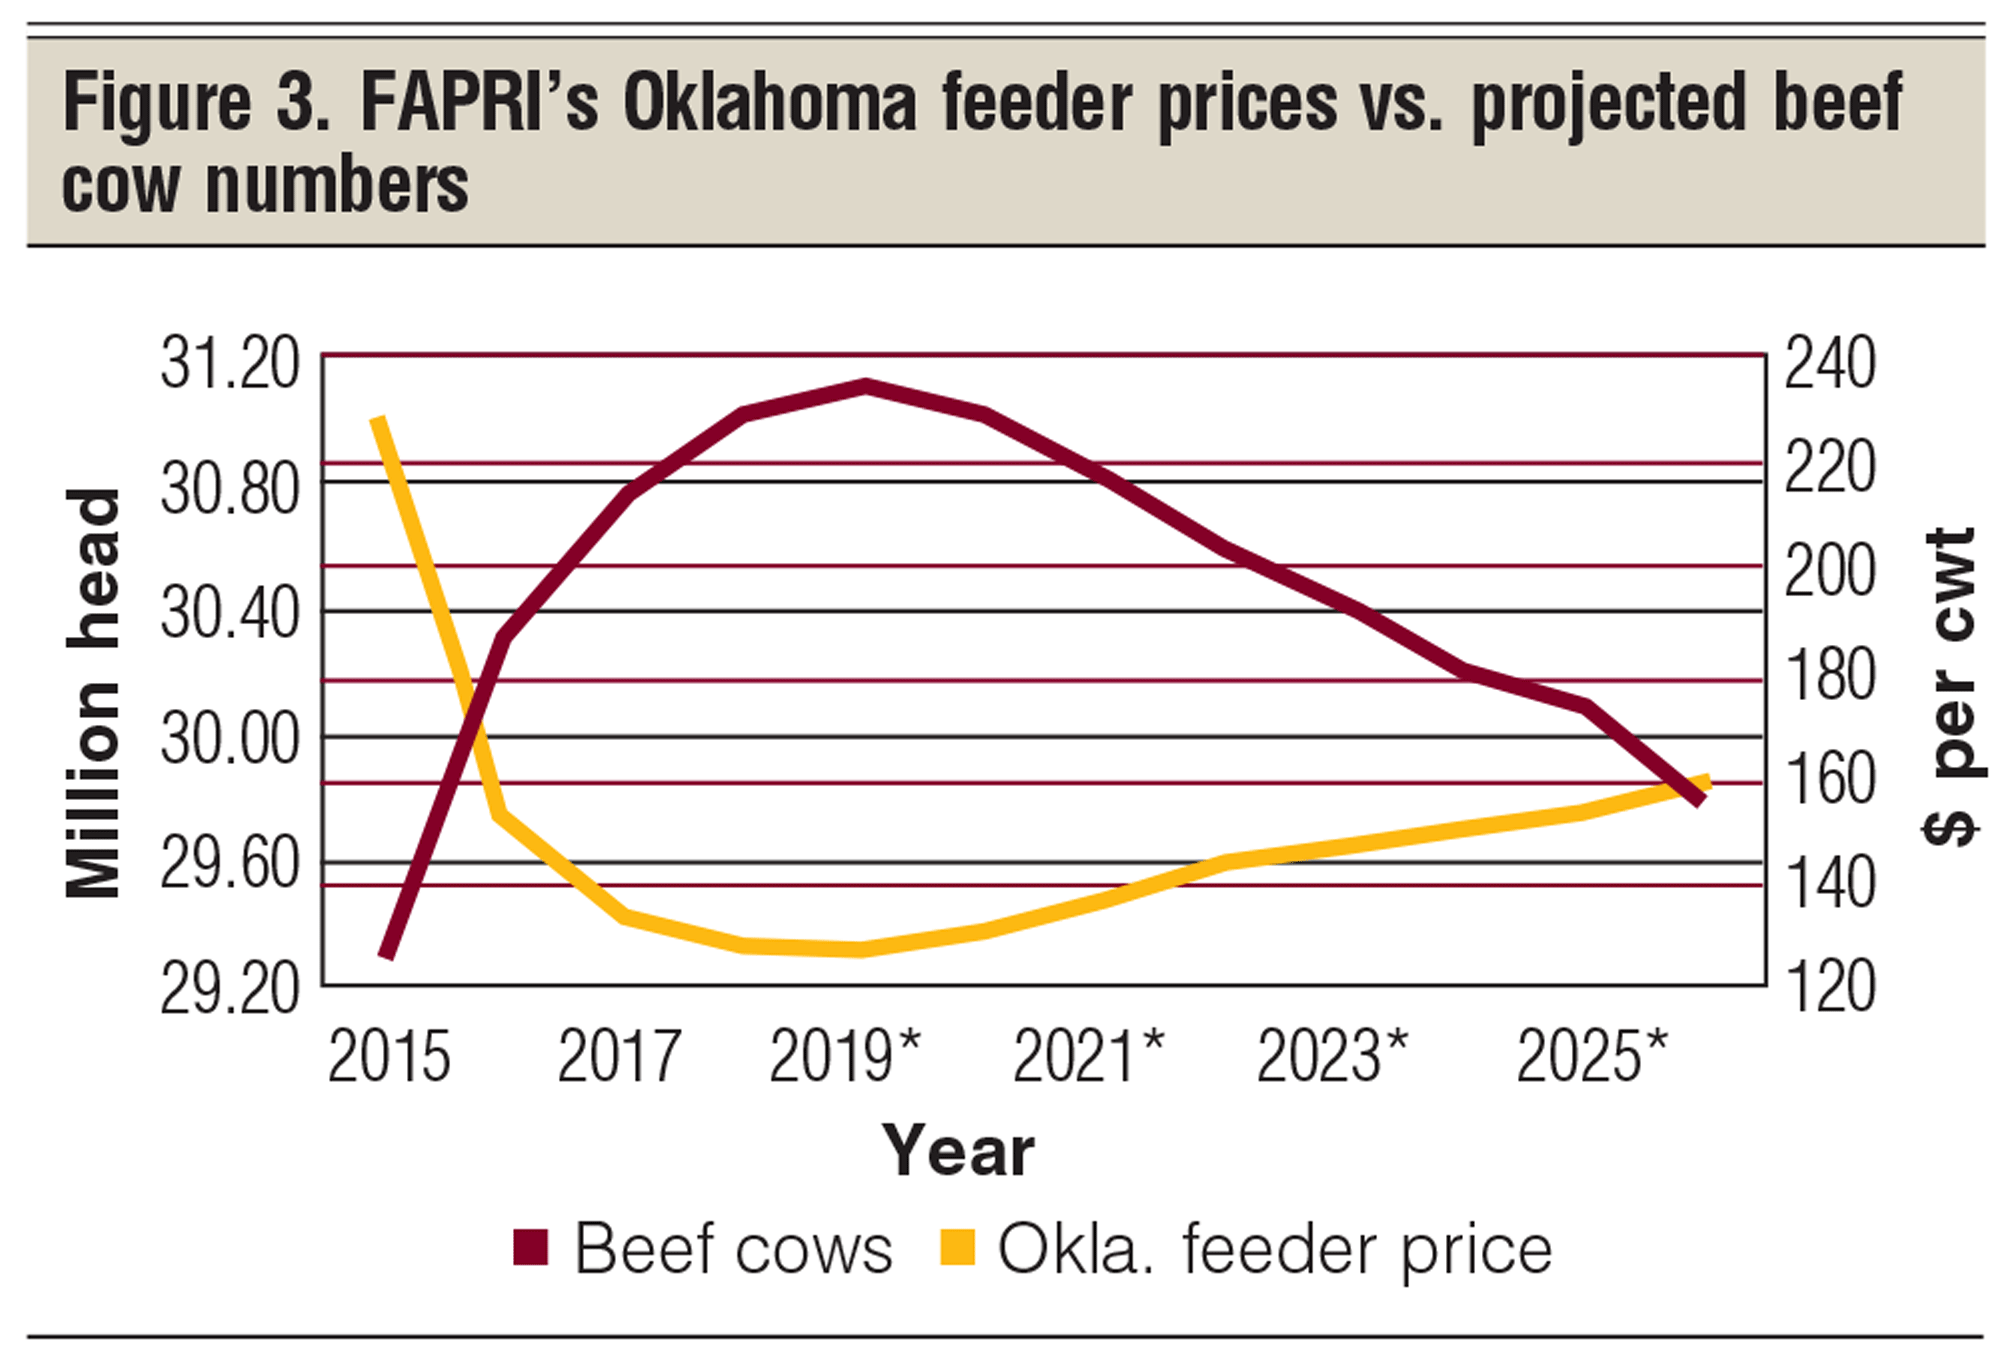
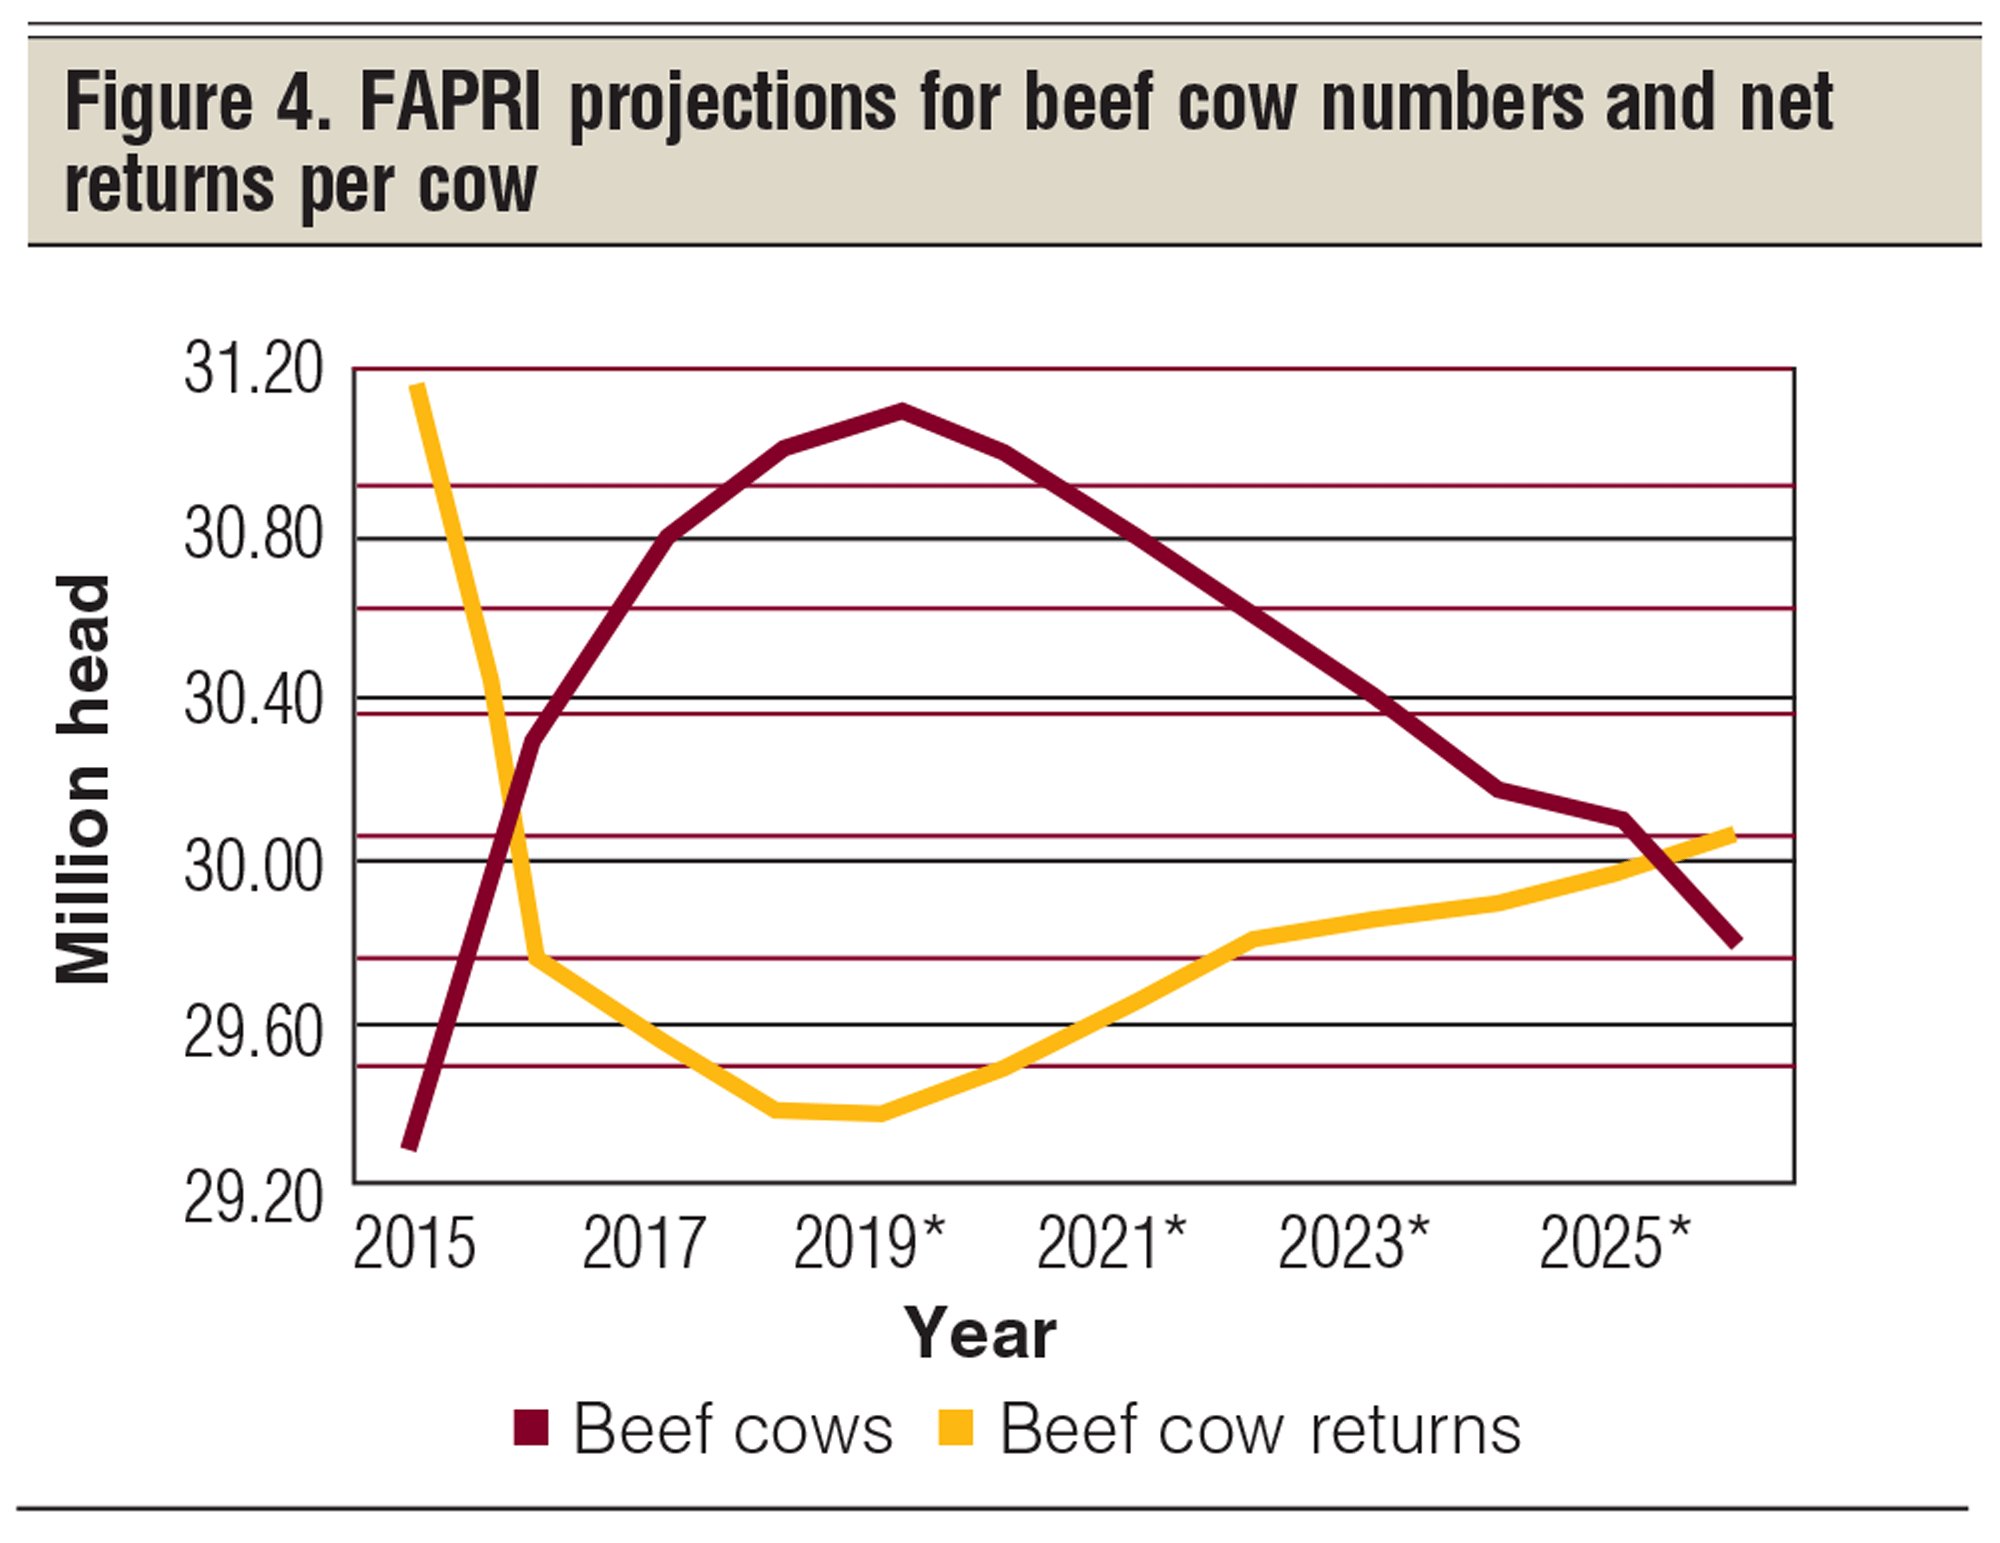
Figure 4 presents FAPRI’s projections for beef cow numbers vs. profit-per-cow projections for the rest of the current cattle cycle and well into the next cattle cycle. The red line represents the projections for the number of beef cows, and the yellow line represents the projected returns per beef cows.
In summary, years 2018, 2019 and 2020 are projected to be challenging years for beef cow producers. Low production costs will be critical.
Economic value of replacement heifers
The economic value of a replacement heifer is made up of two items: the net income generated from all the calves produced while that female is in your herd, plus the cull value at the end of her productive life — or when she is sold. These annual values need to be discounted back to the year of the preg-check.
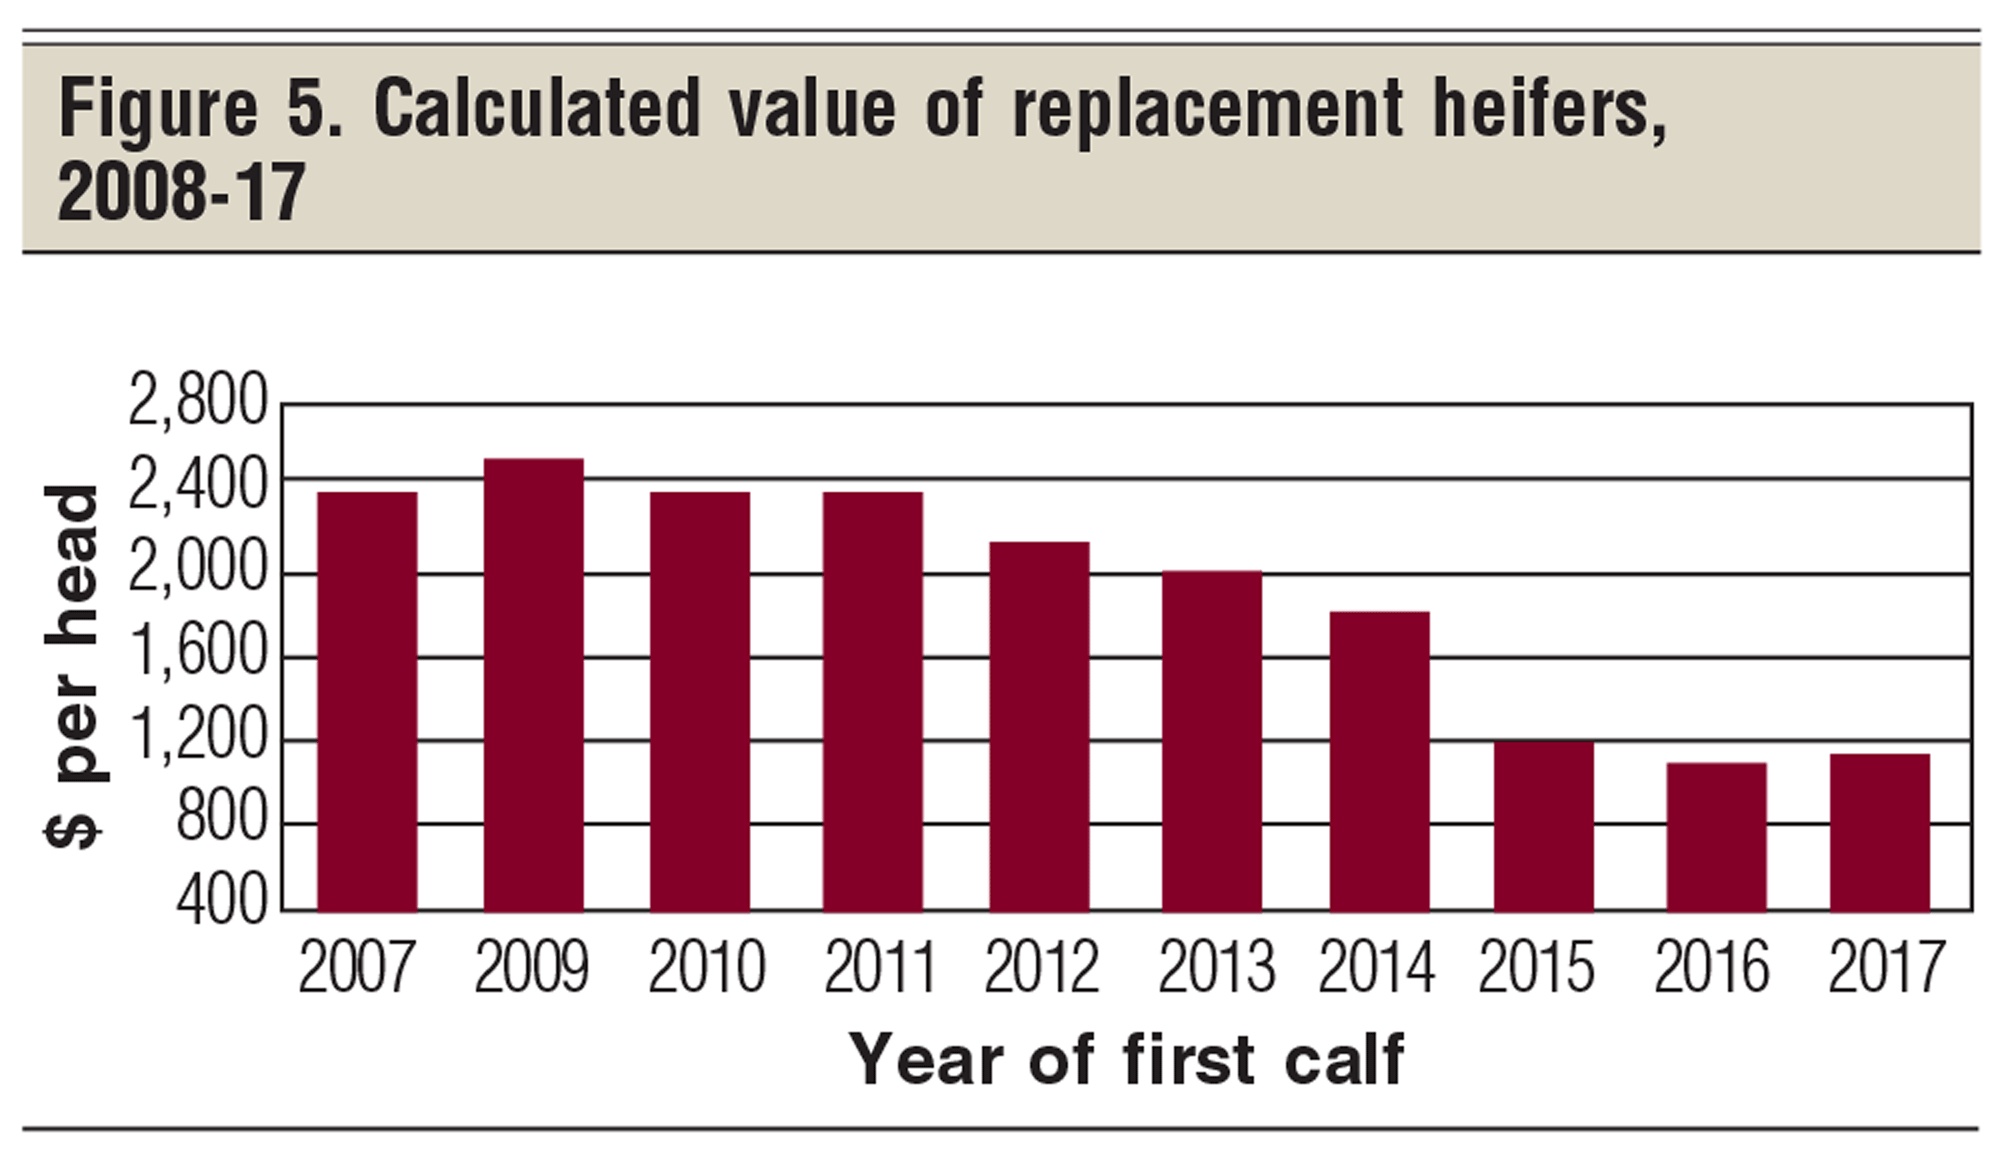
Figure 5 summarizes my calculated values of replacement heifers for this cattle cycle for my western Nebraska-eastern Wyoming study herd (2008-17).
The assumptions used in this study:
- Female has a productive life of seven calves, and then she is culled.
- Total value is based on annual net lifetime income discounted back to preg-check year, with a 3% discount factor for time value of money.
- Cull income is discounted back to year of preg-check at 3%.
- Lifetime earnings are based on Northern Plains average annual returns through 2017 and FAPRI projections of net income through 2018-23.
Tentative conclusions:
- All females calving in the first half of a cattle cycle should have calved in the peak price year (2014 in this cycle). This was such a good year that it added considerable value to all 2008-14 replacement heifers.
- One replacement female will have been culled and sold in the record price year. In this case, it was the 2008 replacement heifer culled in 2014.
- Females added in the one to five years past the peak price year will produce calves in lower-priced years, resulting in these females being of less economic value.
- Females entering the herd seven years or fewer before the cattle cycle price peak are the most valuable replacement heifers.
- Females entering the herd the first four or five years after the peak prices are of considerably less economic value.
My final suggestion
The first half of a cattle cycle is the offensive portion of a cattle cycle; where you should increase cow numbers; the last half of the cattle cycle is the defensive portion, where you should reduce the number of replacement females.
I suggest that we are now in the defensive portion of the current cattle cycle.
Hughes is a North Dakota State University professor emeritus. He lives in Kuna, Idaho. Reach him at 701-238-9607 or [email protected]



Leave A Comment